Would like to share some details on a 2D Robot mapping software I am currently working on. I have including a video of a robot using a map generated by this software to autonomously navigate and simulate doing an office delivery. Will add new update showing the mapping software in action.
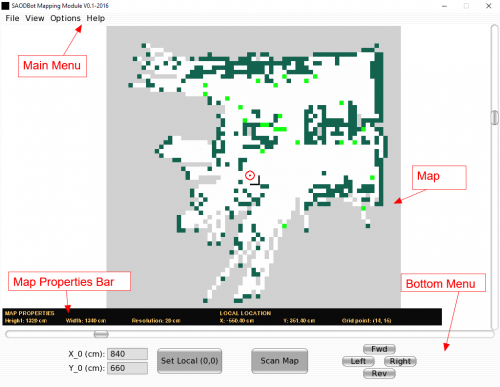
Mapping Module Graphic User Interface
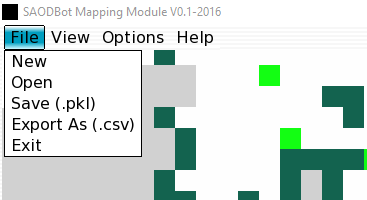
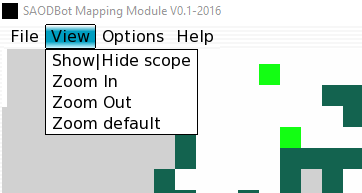
Main Menu - This contains the major operations that is possible with the program.
Bottom Menu - The bottom menu contains frequently used commands. The includes access to the scan command and an option for setting the zero coordination reference point on the map. The point represents the zero or home position of the robot on the map in both X and Y direction.
Map Area - The map occupies the central region of the program window. The Map consist of a 2D matrix with each cell in the matrix colored to represent a range of probability values:
- Probability values between 0.8 and 1 are represented by dark green cells. This area is occupied. - Probability values between 0.79 and 0.51 are represented by neon green cells. This area is uncertain. - Probability values between 0 and 0.49 are represented by white cells. This area is empty. - The probability value of 0.5 is represented by gray cells. This area is unexplored.
Map properties bar - The properties bar shows the important map properties such as height, width and resolution of the grid cells. The properties bar also shows the grid coordinate x and y value of the grid cell locator.
Table 1-7 outlines a summary of the mapping process. The process start with the creation of an empty occupancy grid map. To do this the width and height of the general area to be mapped, the size of the grid cell and the X and Y origin on the map is needed. All unit dimensions are given in centimeters. See the section on testing for the different map properties tested. The map is initialize with a probability value of 0.5.
The next step involves the scanning of the area to be mapped with Ultrasonic, LIDAR-lite or infrared sensor mounted on a servo. This results in the capturing of a maximum of 180 points of measurement. The measurements are then converted from polar coordinates to rectangular coordinates then sent from an Arduino robot to the mapping software module. The module transforms each measurement points from Arduino's local frame of reference to Software grid map frame of reference.
Next, for each measurement point which returns a probability of hitting an obstacle, the occupancy grid module traces all the grid points which are directly inline with it from the robot’s current location on the grid. It then calculates the probability of occupancy of each of the traced points. Entire grid cells are considered to be occupied or empty even if the obstacle being mapped partially occupies a cell. The resulting probability values are then processed and displayed visually by the Mapping module using the different color values discussed above. The process is completed when the entire area is scanned and represented by the occupancy grid.
The raspberry pi is used to run the mapping software and process the mapping data sent from the arduino
Data is transfered via the serial port. Currently the most reliable serial connection between the two devices I found was to hardwire them with usb cable or with an pi to arduino hat/shield.
360 degree scan is achieved by incoorperating a 9dof sensor in the setup to calculate heading. The heading value from the sensor is then use to transform the reading from the distance sensor into the correct quadrant on the map.
The probabilities are calculated by the software. The user have no input in the calculations.
No, only one distance sensor is used in the mapping process. I give the three because the software can use anyone of them to build the probability map.
Are you asking about processing power or battery power?
The control of the degree of scan is done via the servo motor on which the distance sensor is mounted
The average scan processing time on the raspberry pi is 0.2 sec, so the time it takes to generate a full map depends on the total scans needed, the size of the room and the max distance of the distance sensor. Currently I am using a LIDAR-lite Laser rangefinder with a max distance of 40m. With this I can build a map of a typical room in 8 scan/ 180deg sweeps of the servo moto. Two sweeps in each quadrant of the map.
Currently I am using a LIDAR-lite Laser rangefinder it have a range of 0 - 40m so typical distances falls in this range
I am currently occupied documenting my work with relations to this so I will post a video as soon as things settles.
Yes the robot is rotated inorder to do a full 360 deg scan of a room. The distance sensor is mounted on a servo motor at the front of the robot and the servo is limited to a 0 to 180 deg scan which is half of the full 360. To get the other half the robot is rotated.
The probabilities are calculated using Bayes’ rule of conditional probability. The Occupancy Grid Algorithm calculates the posterior joint probilitity that a single sensor measurement falls within a grid cell due to a given cause, p(Zt, ct | m[x, y]). In simple terms if the lidar rangefinder measures a distance of 40 cm at a servo angle 30 deg, the occupancy grid algorithm calculates the likelihood that the gridcell on the map located at this point is occupy given the fact that we just recieved a measurement saying that it is. Now sensors are not perfect, therefore it is likely the the measurement we just recieved was a purely random measurement, its also possible that the measurement was the result of an obstacle being at that location or it is entirely possible it is as a result of some other noise or its is a maximum measurement reading. The job of the algorithm is to calculate which of these cases are mostly likely. The resulting probability value then is like a confidence rating on the validity of each measurement. Now as the robot continue to scan the same area the more times the sensor returns a reading of 40 cm at 30 degs the confidence rating of this measurement is increased thereby giving rise to an increase probability that the said grid cell is occuppied.
The time of a physical scan depends on the number of degrees between each single distance measurement, the time it takes for the sensor to make each new measurement, the time it takes to positiion the servo at a new angle and data processing time. Taking a measurement every deg takes between 800 to 1500ms for a 0 to 180 deg scan this includes sensor delay time, servo delay time and measurement processing time on the arduino.
I am not using a Bayes Network instead, I am using a Joint Distribution. See the following link for a full explaination of the standard occupancy grid algorithm using an inverse sensor model: http://dai.fmph.uniba.sk/~petrovic/probrob/ch9.pdf
I just saw your comment under my Mapping Rover. The code for my lastest rover using LidarLite and an onboard raspberry pi can be found at https://github.com/stheophil/MappingRobot2
It is lacking in documentation currently, but I will update that in the coming weeks. The raspberry code currently contains an implementation of a naive particle filter to solve the SLAM problem, i.e., the simultaneous localisation and mapping problem, as described in Thrun’s book Probabilistic robotics. I’m working through that and implement stuff I find interesting for my robot.
Keep it up, there’s no better way to learn than to implement stuff yourself!
Did you use an utlra sonic sensor and the LIDAR - Lite sensor? I am planning on building a similar project but from what I’ve research, the LIDAR sensor is much more accurate. Thank you!