

The details of installing Node Red on a Raspberry Pi won't be gone into here but here's some good links to help with installing Node Red:
-
NodeRed.org
-
Steve's Guide: http://stevesnoderedguide.com/installing-node-red
Some Raspberry Pi may have Node Red already installed but if not, here's a link to download Node Red: https://nodejs.org/en/
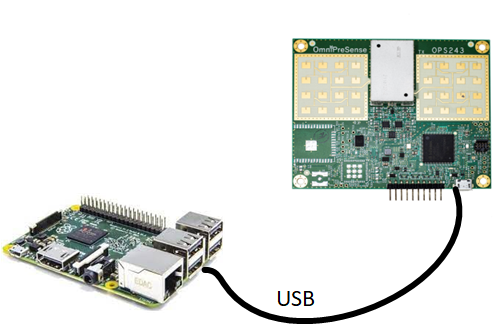
It's a simple connection, one USB micro cable from the Node Red USB port to the OPS243-A USB micro connector. The USB provides power to the radar sensor and the data will flow from the sensor to the Raspberry Pi once it's powered on. Make sure the Raspberry Pi has a good power source, 2A power supply is recommended. We've seen some Raspberry Pi starve the USB ports of power.
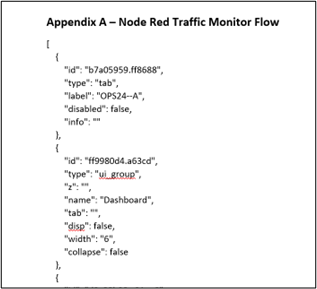
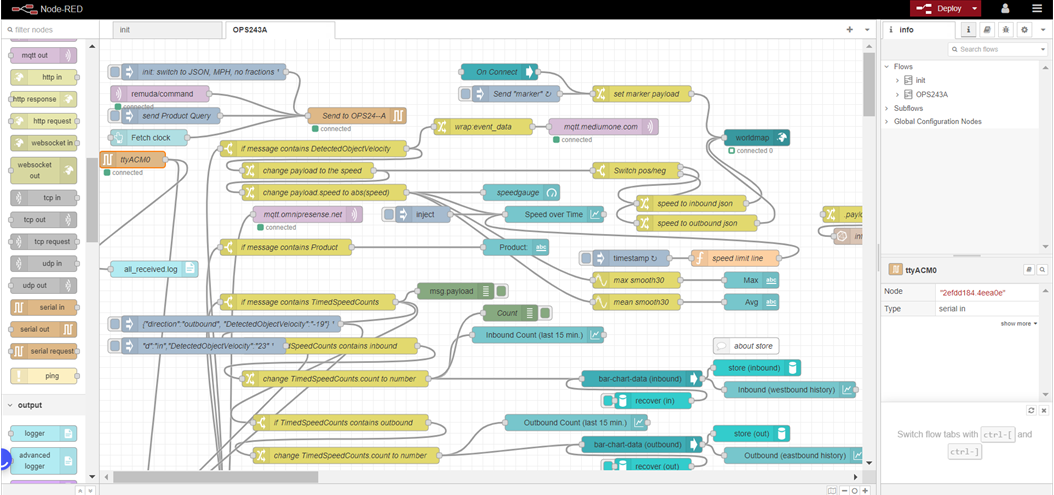
Next, import the traffic monitor flow into Node Red. The flow can be found here. The Import selection is to the right side of the Node Red window. Before importing, change the filename prefix from .pdf to .json as Node Red uses flows in JSON format. You may need to import additional nodes into your window to support the flow. These nodes may be represented with a red dot on them.
There's several configurations you'll want to make to the dashboard for your usage. For example, there's a map which can take in your desired longitude/latitude. For accessing the data from your OPS243-A sensor, make sure to configure the Serial Port node with /dev/ttyACM0:19200-8N1 or similar. See the AN-25 Node Red Traffic Monitor Dashboard application note for details of the node configurations.
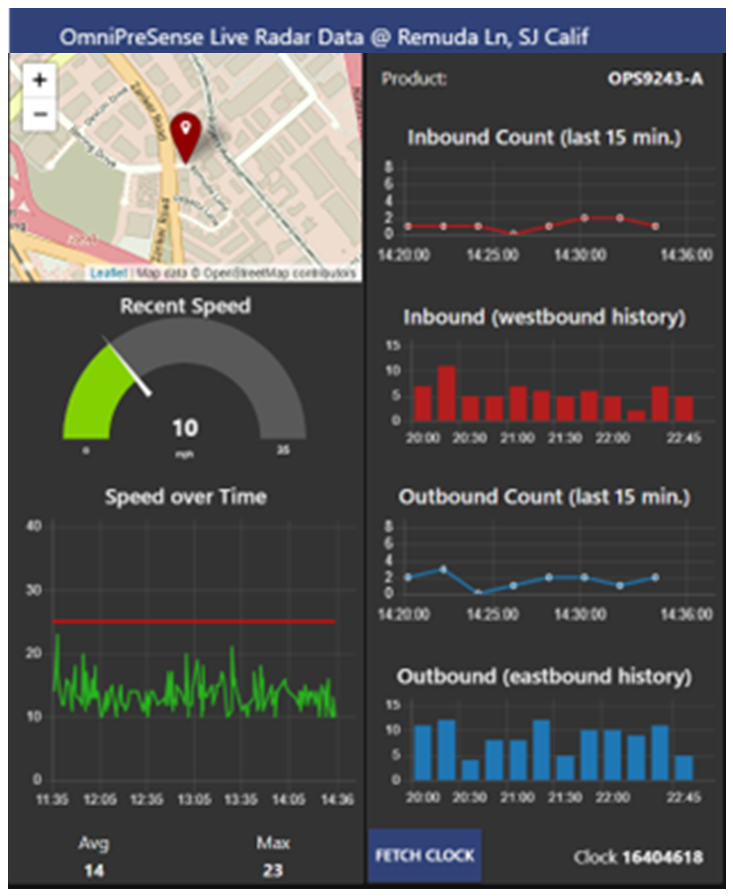
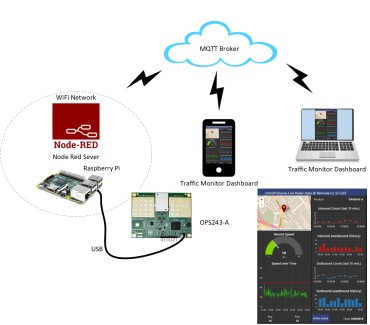
On the Node Red dashboard in the upper right is a Deploy button. Select that and your dashboard will be deployed. If using a local Node Red server, it's usually viewable on port 1880. The live dashboard from the AN-25 noted above is available for viewing here.