


Build a WEB publisher/monitoring station.
Experiment: WEB Publisher of logged data with temperature and humidity.
AltonaLab diagram: KIT_TempHumWEB.nsm
Used hardware:
- Numato 8 channel USB GPIO Module;
- Connector board for ADC 5V;
- AltonaLab temperature sensor;
- AltonaLab humidity sensor;
- 5V multi connector power supply board;
- 220V to 12V, 2A power supply;
WEB Publisher is a very powerful tool for many areas. For example, if we want to monitoring the temperature and humidity conditions of our home and how the flowers feel when we are away in holiday, then we can use the described below Publisher. The non stop running computer in our home will upload to FTP Server an information for temperature, humidity and image from WEB cam, directed to our flower. It looks difficult, but using AltonaLab is very easy.
The experiment demonstrate two type of WEB site publishing:
Saving as JPG images some of controls available on AltonaLab diagram, then uploading the saved JPG files to the FTP Server;
Saving some signals as tags in XML file, then uploading the XML file to the FTP Server;
The main idea of the WEB publisher is - using the parameter For upload of block FTPUpload, we can choose the names of which of the existing controls of the AltonaLab diagram to be uploaded to the FTP Server. In the current diagram, are selected: the two Text controls for Temperature toTemp and for Humidity toHum, ImageControl and WebCam controls. When the input DoSend of a block FTPUpload becomes to a high level, all the selected controls are saved as image files with jpg extension and Name of the file is same as Name of the control, then this files are uploaded to FTP Server. Then we just have to refresh the Internet browser and new images will be shown on the WEB page. This very easy to use way has one serious disadvantage - an internet traffic. If our non stop running computer uploads to the FTP Server four images on every 5 or 15 minutes, for 24h it will rise a lot of internet traffic. So we have to find a way to reduce the traffic. This is the reason because the current Date and current state of a Temperature and a Humidity to be saved to TAGs in XML file and then to upload the XML file to the FTP Server.
Before starting of the diagram, please read all the article, because many additional activities are needed.
The used hardware diagram is same, as in the previous experiments for measurement of temperature, humidity and logger.


The used AltonaLab diagram:

The demo WEB Page can be seen at the URL below:
http://altonalab.com/kit/kit_demo.php

The features of the WEB page are:
Some of the information on the Page is gotten from a file info.xml, which is prepared and saved from AltonaLab diagram and then is uploaded to the FTP Server;
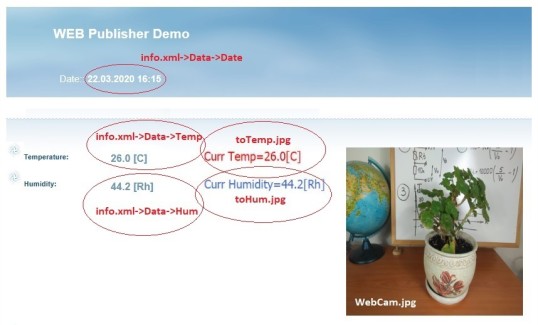
Date at the top of the WEB page is gotten from tag Date in XML file;
Temperature and Humidity are show in two columns, the left values are gotten from the TAGs in XML file, the right columns are small JPG image files, which are uploaded to the FTP Server;
WEB cam image is presented with WebCam.jpg;
The bottom sensors history graphic is ImageControl.jpg;
AltonaLab diagram consists of six parts:
- Controls - two text controls for showing the current state of temperature and humidity, an Image control to show the history of the sensor's signals, a button Upload to FTP, when we press the button, all the information will be uploaded to FTP server, FTP Result - a text control which shows the result of FTP operation, WEBCam control - directed to the monitoring object;
- Measure of temperature and humidity - is same as previous experiments. The Numato functional block reads the voltage values of the sensors for Temperature and Humidity. Then voltage values are converted to Temperature and Humidity by the blocks AltonaSensorTemp, AltonaSensorHumidity;
- Logger - this part is well explained in experiment Logger for temperature and humidity. The block DBFStorage saves the measured values of Temperature and Humidity in DBF database, the block DataSetImage shows the contains of a DBFStorage block on an Image control;
- Preparation of info.xml - the XML file is prepared and saved from a block XMLSaver. With its parameter Inputs are defined the block's inputs Date - DateTime data type, Hum - analog data type, Temp - analog data type. Using the block's parameter XML Tags, are defined the file's XML tags:
Tag Date: <Date;dd.MM.yyyy HH:mm>
Tag Hum: <Hum;1>
Tag Temp: <Temp;1>
Every XML tag is formatted based on the TAG expression and the inputs included into the expression. Every TAG expression can include more than one input. The block uses a Text formatting conception, which is described below:
https://scada.altonalab.com/index.php/en/conceptions/text-formatting-strategy
For example, the Temp is converted to a string with one digits after the dot, because in the TAG's expression is set to the formatting string <Temp;1>, where Temp is a name of the block's input. The Date is converted to a string with formatting text set in the TAG's expression <Date;dd.MM.yyyy HH:mm>, where Date is a name of the block's input. The result of the block is 22.03.2020 16:15.
The block's parameter FileName is set to: c:\AltonaLab\info.xml. When the input Write of the block becomes to a high level, the values of the all inputs will be saved as TAGs in XML file. The saved XML file in our case looks like:
<?xml version="1.0" encoding="UTF-8"?>
<Results>
<Header>
<ExpDate>20200322 16:15:43</ExpDate>
</Header>
<Data>
<Date>22.03.2020 16:15</Date>
<Temp>26.0</Temp>
<Hum>44.2</Hum>
</Data>
</Results>
- Upload to FTP - this part of the diagram is responsible to upload the JPG and XML files to the FTP Server. The block's parameter For upload of block FTPUploader opens the interface below, where all the existing controls on the current AltonaLab diagram are shown in the top grid. Selected controls are ImageControl, toHum, toTemp, WebCam. This means, when the block's input DoSend becomes to a high level, the selected controls will be saved as JPG image files with same names as the control's names. For example, the control toTemp will be saved as toTemp.jpg. Then all the saved JPG files will be uploaded to the FTP Server. At the same interface, at the next grid is added a local file for upload: c:\AltonaLab\info.xml. Together with the mentioned JPG files, the added xml file will be uploaded too:

FTPUploader block has a few parameters, important for a FTP communication: FTP Server, FTP User, FTP Password, FTP Folder. All they have to be entered before to start some tests of the AltonaLab diagram.
- The last part of the diagram is а FTP sequence synchronization. The files can be uploaded if the button Upload to FTP is pressed or on every 10 min - this is a time set in block Blk11, which is a PulseGenerator with 10 min time period. If one of these events happens, the sequence of FTP upload will be started. At first the input Write of a bock XMLSaver will become to a high level and a file info.xml will be saved. At the same time a new TimeOut for a 1 sec will be started - block Blk17, enough time the XML to be formed and then the FTP upload to be started. And after one second, the input DoSend of the block FTPUploader will become to a high level, this will start the upload process and all the JPG and XML files will be uploaded. A few seconds later, the result of the FTP attempt will be reported to the SendResult output of the FTPUploader block. This string output will be shown on the Text control at the top of the diagram, located over the WebCam.
The content of the Demo WEB page can be downloaded from the URL below:
http://altonalab.com/kit/KITWebPublisher.zip
With every FTP client, we can deploy the Demo WEB page to a FTP folder, the files are:

The main WEB page file is a kit_demo.php. If only JPG files are uploaded, the WEB page can be with file extension htm, but in our case a XML file is uploaded and its contents can be shown only with php code. Date is shown with the php code below:
$xml = simplexml_load_file("info.xml");
echo $xml->Data->Date;
The PHP code for Temperature is:
$xml = simplexml_load_file("info.xml");
echo $xml->Data->Temp;
And for humidity:
$xml = simplexml_load_file("info.xml");
echo $xml->Data->Hum;
Warning!!! Before starting the diagram, some settings have to be set:
Set all the parameters of FTPUploader block for FTP Server: FTP Server, FTP User, FTP Password, FTP Folder;
Click with right mouse button over the WebCam control and then at the parameter WebCam, choose an existing WEB cam on the computer (the parameter is a combobox);
Of course a Communication port of Numato functional block has to be set too - as all the previous experiments;